Prometheus 3.4.2在Windows下的安装使用
本文主要介绍在Windows系统下通过ZIP文件安装Prometheus 3.4.2。
下载安装包
从Prometheus官方(https://prometheus.io/download/)下载3.4.2版本编译文件压缩包(如prometheus-3.4.2.windows-amd64.zip)。
解压至目标目录(如D:\dev\monitor\prometheus-3.4.2.windows-amd64)。其中,该目录下有以下几个文件:
- prometheus.exe
- promtool.exe
- prometheus.yml
配置和启动Prometheus
配置Prometheus
prometheus.yml默认配置如下:
# my global config
global:
  scrape_interval: 15s # Set the scrape interval to every 15 seconds. Default is every 1 minute.
  evaluation_interval: 15s # Evaluate rules every 15 seconds. The default is every 1 minute.
  # scrape_timeout is set to the global default (10s).

# Alertmanager configuration
alerting:
  alertmanagers:
    - static_configs:
        - targets:
          # - alertmanager:9093

# Load rules once and periodically evaluate them according to the global 'evaluation_interval'.
rule_files:
  # - "first_rules.yml"
  # - "second_rules.yml"

# A scrape configuration containing exactly one endpoint to scrape:
# Here it's Prometheus itself.
scrape_configs:
  # The job name is added as a label `job=<job_name>` to any timeseries scraped from this config.
  - job_name: "prometheus"

    # metrics_path defaults to '/metrics'
    # scheme defaults to 'http'.

    static_configs:
      - targets: ["localhost:9090"]
       # The label name is added as a label `label_name=<label_value>` to any timeseries scraped from this config.
        labels:
          app: "prometheus"
- scrape_interval:控制数据抓取频率,默认1分钟,建议缩短至15秒以提升实时性。
- targets:指定监控目标的地址和端口(如Prometheus默认端口为9090)。
启动Prometheus
在Windows下,执行如下命令启动:
.\prometheus.exe
验证Prometheus Server端
看到如下日志,则证明启动成功:
time=2025-07-03T07:20:53.094Z level=INFO source=main.go:1287 msg="filesystem information" fs_type=unknown
time=2025-07-03T07:20:53.094Z level=INFO source=main.go:1290 msg="TSDB started"
time=2025-07-03T07:20:53.094Z level=INFO source=main.go:1475 msg="Loading configuration file" filename=prometheus.yml
time=2025-07-03T07:20:53.116Z level=INFO source=main.go:1514 msg="updated GOGC" old=100 new=75
time=2025-07-03T07:20:53.116Z level=INFO source=main.go:1524 msg="Completed loading of configuration file" db_storage=0s remote_storage=0s web_handler=0s query_engine=0s scrape=21.489ms scrape_sd=0s notify=0s notify_sd=0s rules=0s tracing=0s filename=prometheus.yml totalDuration=22.0476ms
time=2025-07-03T07:20:53.116Z level=INFO source=main.go:1251 msg="Server is ready to receive web requests."
time=2025-07-03T07:20:53.116Z level=INFO source=manager.go:175 msg="Starting rule manager..." component="rule manager"
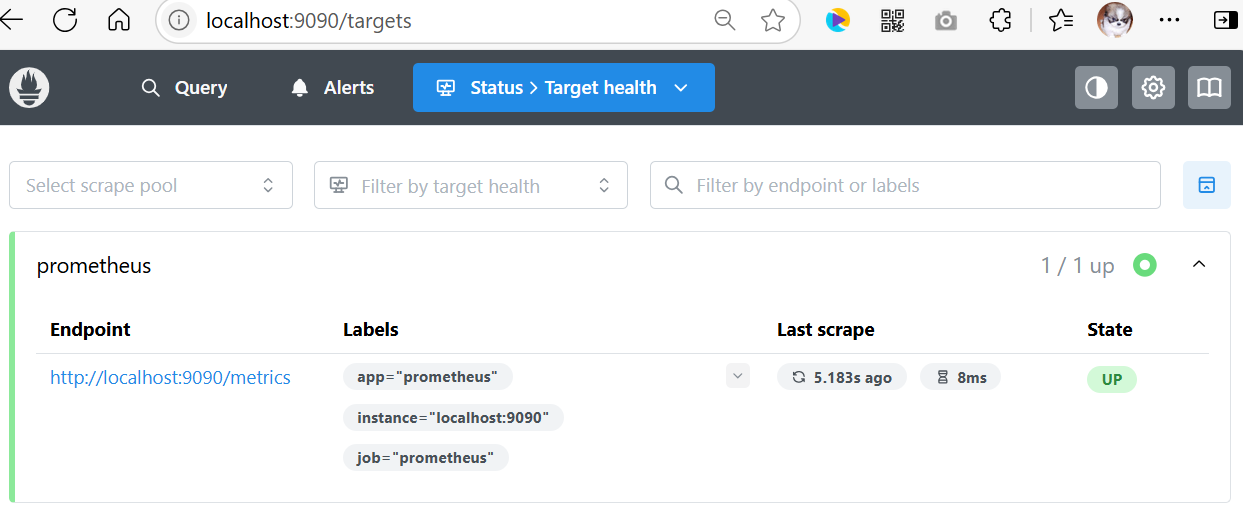
访问Web界面
浏览器打开http://localhost:9090,进入Prometheus的Web界面。
点击左侧菜单Status → Targets,确认所有配置的targets状态为UP(绿色)。
若状态为DOWN(红色),检查目标服务是否运行、防火墙是否放行端口(9090等)。
安装Exporter(可选)
有许多库和服务器可以将第三方系统中的现有指标导出为Prometheus指标,支撑导出功能的组件称之为Exporter。各类Exporter列表参见https://prometheus.io/docs/instrumenting/exporters/。若需监控Windows系统指标(如CPU、内存、磁盘),则下载安装Windows Exporter即可;要监控MySQL就安装MySQL server exporter。
以Windows Exporter为例,选择下载.msi安装包(如windows_exporter-0.30.8-amd64.msi)。运行下载的.msi文件,指定安装目录(比如D:\dev\monitor\windows_exporter),按提示完成安装。安装完成,会自动注册为Windows服务,随系统自启。当然也你也可以改为手动。
安装后,浏览器访问http://localhost:9182/metrics,若能看到系统指标数据,则安装成功。
注册Windows Exporter(可选)
在prometheus.yml配置中添加如下:
# ...为节约篇幅,此处省略非核心内容

scrape_configs:
  #  ...为节约篇幅,此处省略非核心内容

  - job_name: "windows_exporter"  # 监控Windows系统(需安装Windows Exporter)

    static_configs:
      - targets: ["localhost:9182"]
        labels:
          app: "windows_exporter"
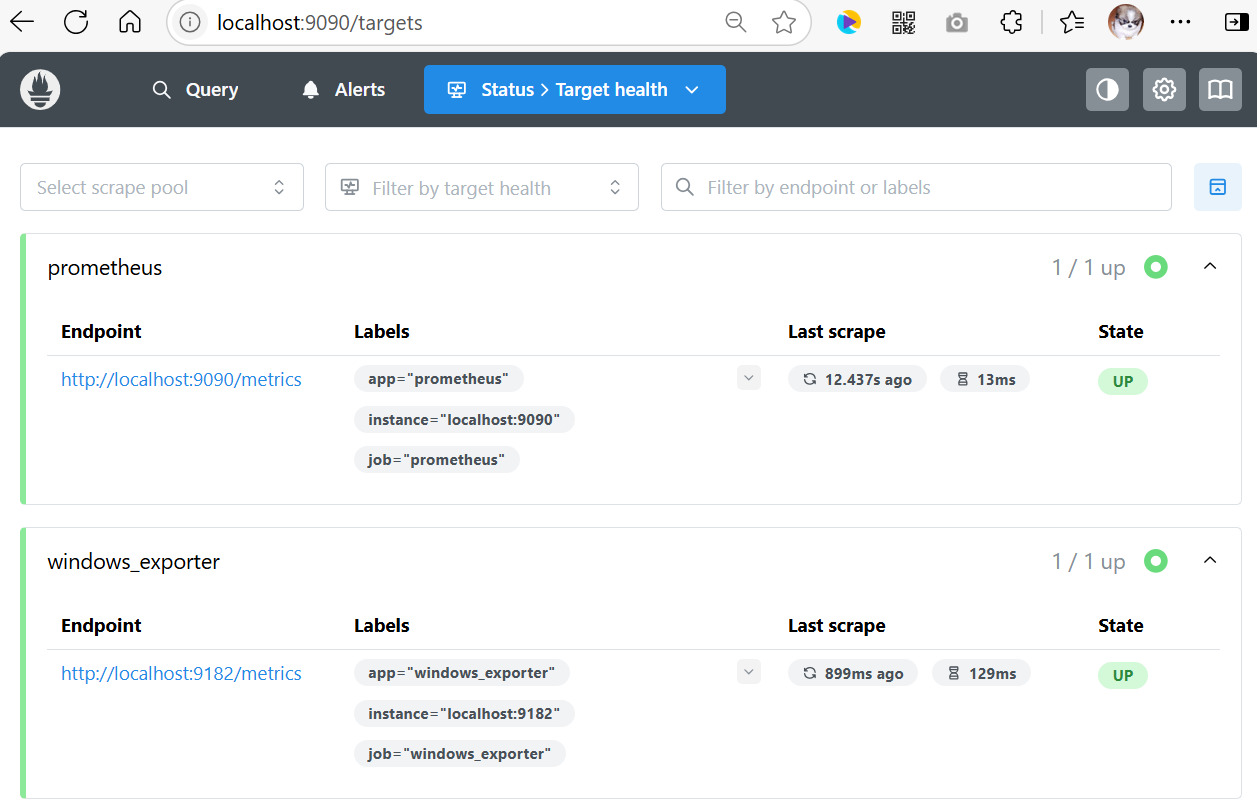
此时,再打开浏览器访问http://localhost:9090,进入Prometheus的Web界面,就能看到Windows Exporter集成的数据了。
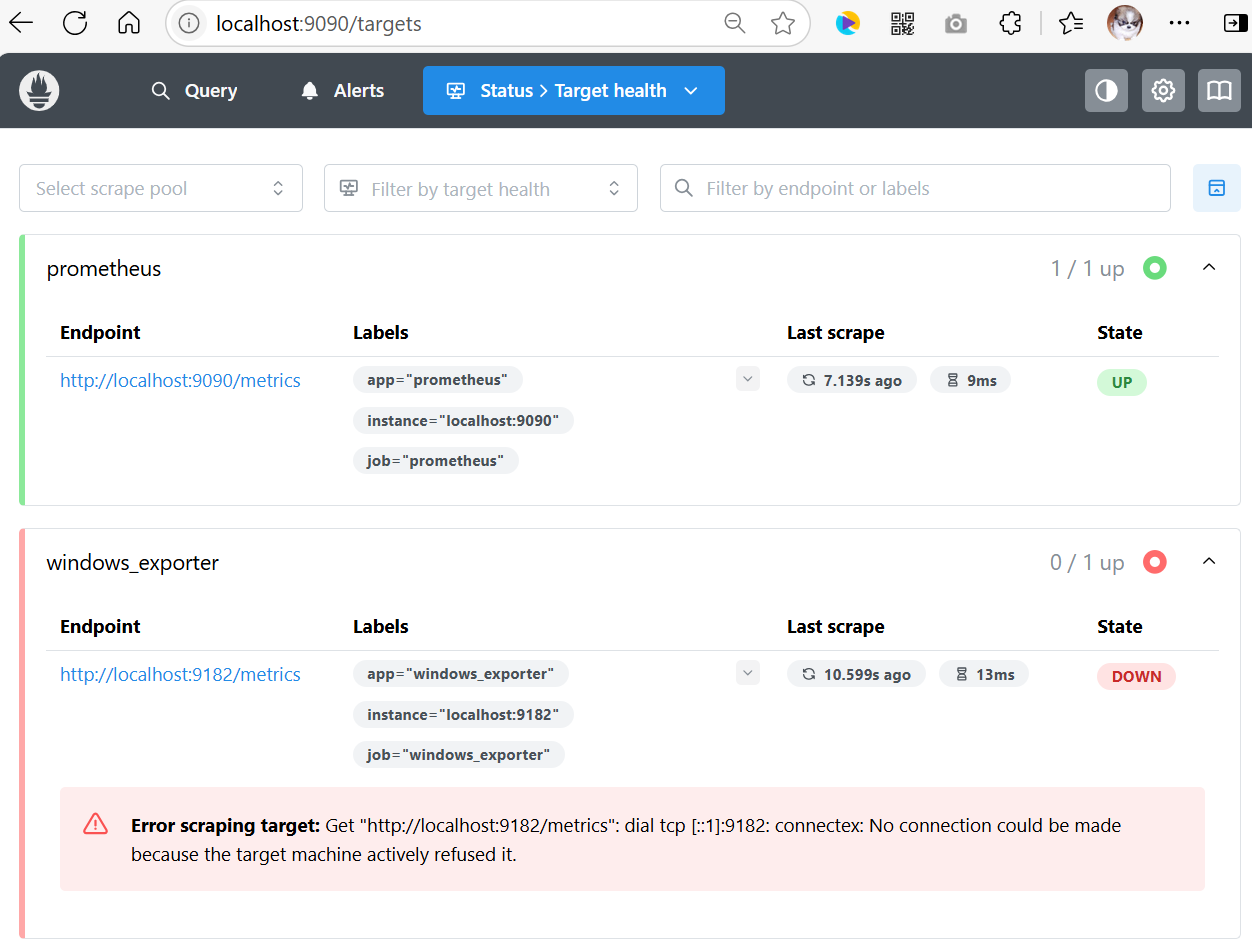
如果停止Windows Exporter程序,可以在Web界面检测到Windows Exporter程序的状态。
参考引用
- https://prometheus.io/docs/introduction/overview/